As an event organizer, we know you value data that detects trends in ticketing, sales, and consumer behavior. It’s why our engineers built Timelines as one of our system’s powerful analytics tools. Timelines gives you the power to compare and contrast patterns in your ticketing data so you can sell more tickets to future events.
Use Timelines to answer the following questions from your ticket data:
Am I selling when my customer is most likely to buy?
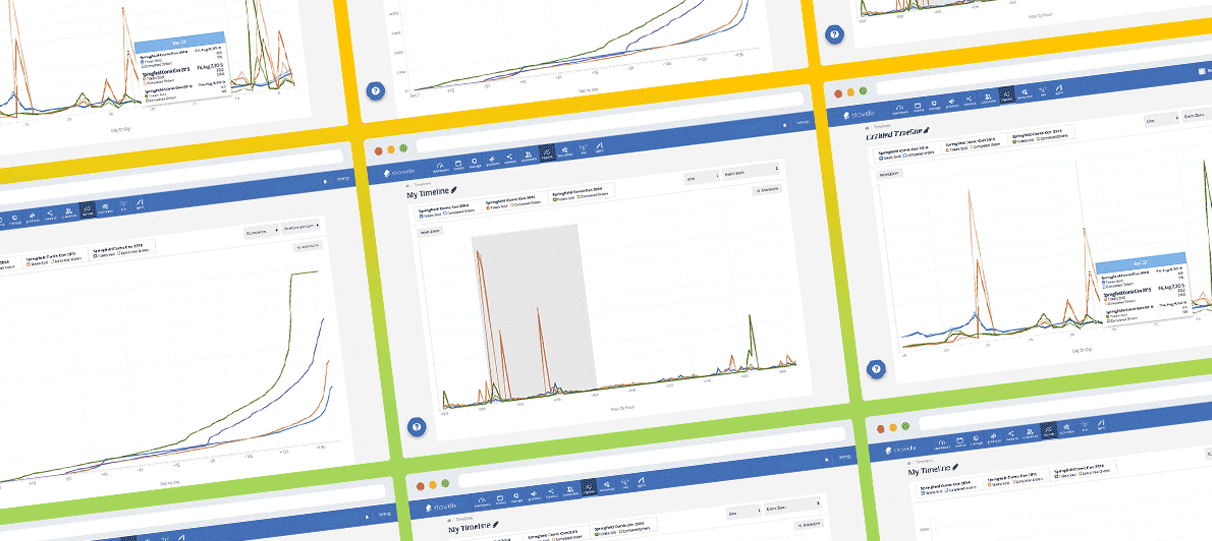
Use Timelines to visualize the health of your on-sale. Compare multiple year-over-year data to anticipate peaks and troughs in ticket sales and adjust your strategy to your customers’ buying habits. Plan marketing campaigns during periods where sales activity is typically low, or anticipate sales peaks to create dynamic pricing models and increase revenue.
Are my marketing campaigns effective?
Easily observe the impact of marketing campaigns. Analyze a full calendar timeline of your event’s sales to determine which marketing campaigns are most powerful. Get granular with an hour-to-hour analysis that detects spikes from an email campaign, social announcement, or other marketing effort. Armed with this information, craft data-informed strategies for more successful campaigns.
Are there any similarities across different events?
Compare different events to uncover customer behavior to see if there are similar trends across the board. Answer questions such as, “Do tickets sell in a similar way in the spring as they do in the winter?” or, “How do customers respond to the presale versus the general on-sale?” Use that data to uncover overall trends so you can adjust your strategy accordingly.
To learn more about Timelines, how to create your first one, or how to share them with your business stakeholders, visit:
https://support.showclix.com/customer/portal/articles/2560977-how-to-build-and-view-a-timeline