Knowing your audience is key to any event marketing strategy. With detailed insight into your fans’ purchasing behavior, event professionals can learn which marketing campaigns work with their audience and learn valuable insight to increase ticket sales.
Today, we’re excited to introduce Timelines, the latest in a suite of reporting tools designed to make analytics an integral component of your daily workflow. While previous tools have emphasized real-time analytics, Timelines gives you the power to create clear visualizations of historical ticketing data.
Read on to learn how Timelines can help you better understand your event:
Examine YOY sales trends
Compare clear visualizations of YOY sales data to detect trends in ticket sales and answer questions about customer behavior. Learn more about the best time to start selling tickets and better understand the growth of your event.
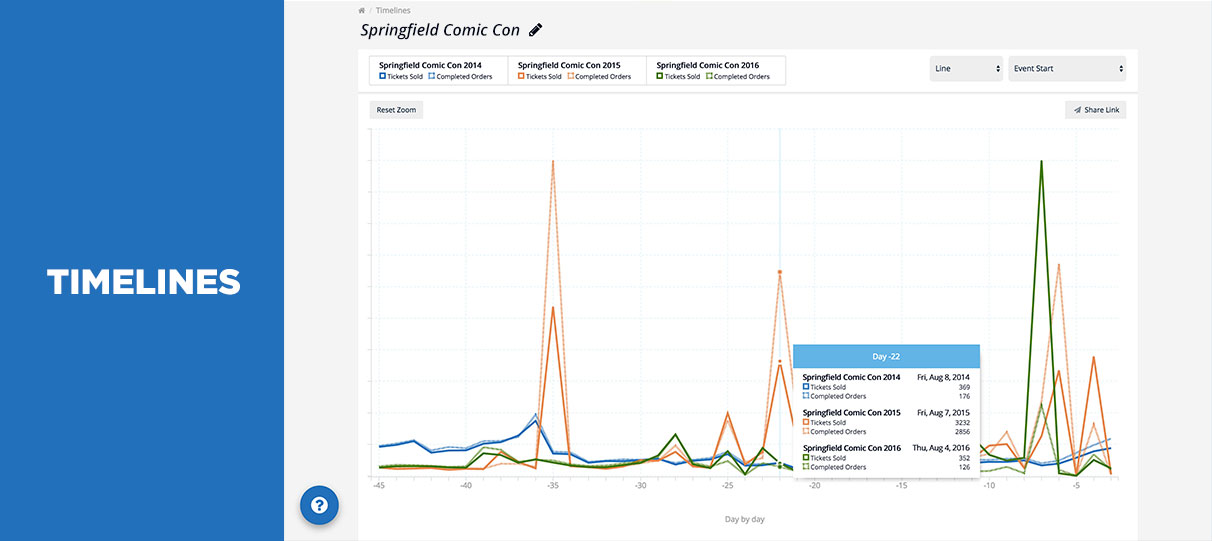
View sales timelines across multiple events
Simultaneously compare sales for multiple events. Several timelines can aligned to specific points in the event lifecycle, allowing you to detect trends in ticket revenue, tickets sold, completed orders, and many other datasets.
Determine whether your marketing push increased sales
Optimize your event’s marketing and keep costs low by tracking which of your marketing campaigns give you a better return on your investment. Compare how your ticket sales fluctuated from the beginning of your campaign to the end to learn which campaigns contribute the most to your bottom line.
Share Timelines’ visualizations with stakeholders
After the analysis has been done, easily share Timelines‘ visuals with your event’s stakeholders. Show them how your event has grown over the years, which event sells the most tickets, and marketing trends.
Get started with Timelines in the ShowClix Admin now, or check out our Timelines User Guide.